Markets entered 2026 propelled by surging AI capital investment, low energy prices, tax cut stimulus and expectations for interest rate cuts. S&P 500 Index Q4 earnings were up 13.2%, pushing stocks’ high valuations upward. On February 25th, the S&P was up 1.6% and the MSCI All Country World Index (ACWI) was up 4.8%.
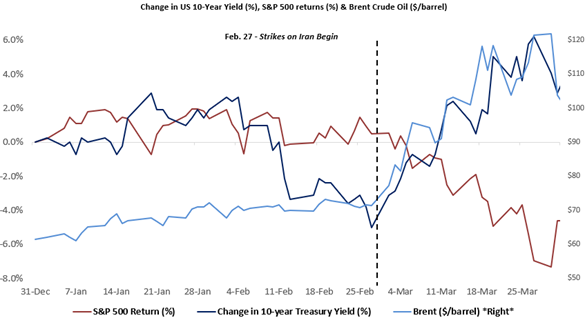
The sudden war with Iran and the closure of the Strait of Hormuz has upended the global economy, sparking inflation fears. Brent crude oil price increased 67% from $60 per barrel on 12/31/2025 to $101 at quarter end. The ten-year treasury yield moved from 3.93% on February 27th to 4.32% at quarter end. The S&P Index closed the quarter down 4.3%, with the ACWI down 3.2%. S&P earnings estimates still indicate 16% growth for 2026 (well above the historical average of 7%), but these forecasts may not yet reflect the continuing conflict’s impact on global trade and inflation.
The economic impact of the war will depend on the duration of the conflict and the ultimate extent of damage to the energy supply chain, as well as its spillover impact on agricultural fertilizer, helium, aluminum and other downstream industrial and consumer products. Over time this disruption will increase prices and tighten financial conditions for housing and other consumer durables. An extended drop in energy supplies would trip the global economy toward recession. These are powerful incentives for trying to resolve the crisis before the summer.
Our longer-term concern remains the geopolitical shift towards national self-interest and the impairment of global trade and America’s diplomatic alliances. This fragmentation raises economic costs, market volatility and military friction between nations.
Chart 1: Iran War Sparks Higher Oil Prices, Higher Interest Rates, and a Mild Equity Drawdown
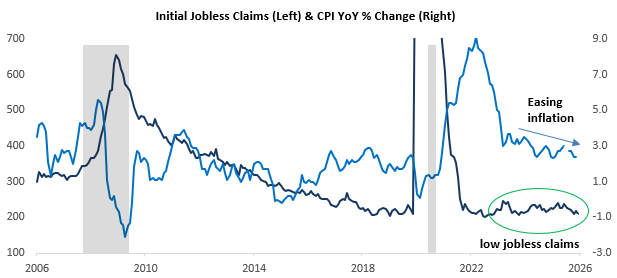
Our recent Quarterly updates highlighted the economy’s continued strengths: Inflation is trending down and initial jobless claims are well below levels that would indicate companies pulling back on employment. The Citigroup Economic Surprise Index, which tracks actual economic data, is positive and rising. It would take a significant shock to derail this positive short-term momentum.
Chart 2: Economic Conditions Remain Positive Entering Q2 2026
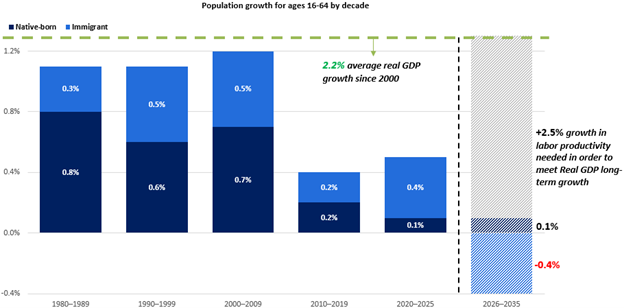
While the US economy benefits from these near-term tailwinds, it is also grappling with policy decisions that hamper long-term structural growth. The immigration clampdown is already affecting international net migration. Where the US added 2.7 million people (+0.5%) in 2024, now it forecasts shrinking the labor market population by 0.3% growth over the next 5 years. This labor shrinking will shave 0.8% from annual GDP growth, lower Federal tax receipts and stress our budget deficit. Economists wonder whether the “AI revolution” will lead to a surge in productivity (growth in real output per worker). However, we would need a very high level of productivity growth – a level we have not seen since the 1950s – simply to achieve 2.2% GDP growth, which was the average over the past 25 years.
Chart 3: Labor Force to Decline Means Higher Productivity Needed to Maintain GDP Growth
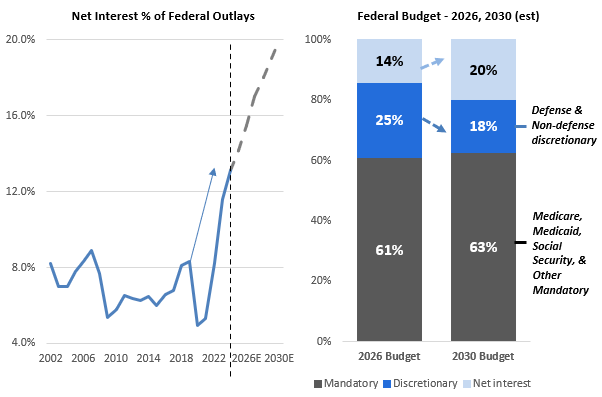
The federal budget deficit is estimated to exceed 7% of government spending in 2026, and the 2025 OBBA tax bill is estimated to raise our annual fiscal deficit by an additional 1.2% of GDP a year through 2034 (Committee for a Responsible Federal Budget.). These large annual deficits will add to the total debt. Each year the US Treasury will need to pay a greater amount to cover the interest that falls due. Moreover, the US Treasury’s borrowing costs might creep up from the current weighted average interest rate of 3.4% toward 4.0%. As a result of these increases, federal interest expenses may grow to nearly 20% of the total budget in just 4 years.
Given that mandatory spending programs account for more than 60% of Federal outlays, such an increase in interest expense will further “squeeze” discretionary spending. When will this increasing pressure push Congress to bridge the budget gap by cutting spending and raising tax revenues?
Chart 4: Rising Net Interest Expense Could “Squeeze” Discretionary Spending
“Gradually, then suddenly” – Ernest Hemingway
Declining population growth and increased fiscal strain typically affect economic conditions gradually, and so investors often do not account for these factors in their market projections. If these trends persist, however, we could see slower forecasted growth in GDP and earnings. In addition, the need to fund the US fiscal gap could eventually “crowd out” corporate and household debt, which would lead to higher marginal interest rates for both businesses and consumers. Both outcomes would drag down valuation multiples for stocks. It is also possible, thankfully, that we could see positive surprises, and America may well resolve these concerns before we hit a crisis point.
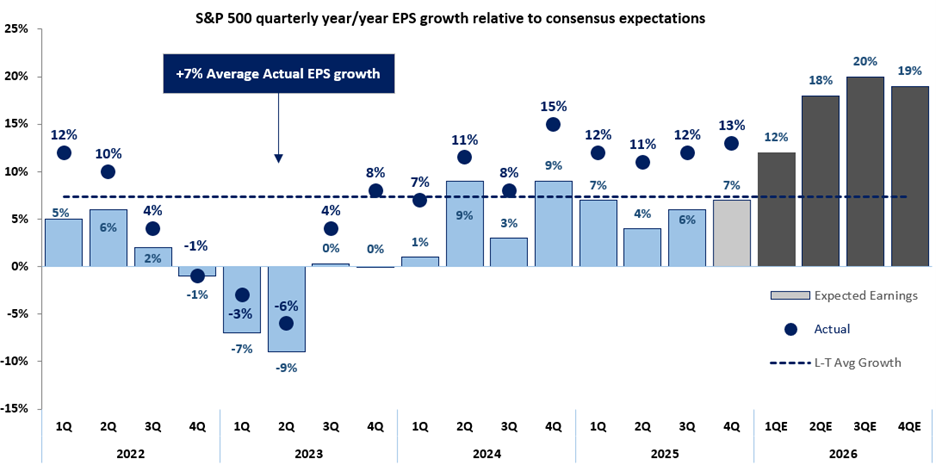
Returning to what might affect markets most strongly this year, as our Q4 Commentary mentioned, consumer and corporate spending were continuing to boost GDP growth, and the stock market benefited from rising corporate earnings prior to the onset of the war.
Chart 5: Earnings Growth Accelerating From Already High Levels Supports Stock Prices
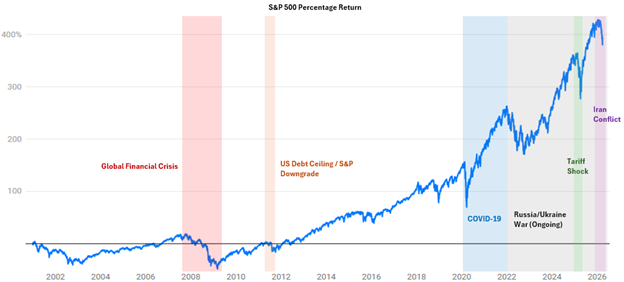
Will this conflict derail the market? Investors seem to believe that the Iran conflict will end soon. However, if the Strait remains closed, the continued production shortfalls in oil and other key inputs will be a rising risk for investors worldwide.Peace in the Middle East is always tenuous and fragile. When uncertainty is so high, history shows that maintaining your long-term strategy is the best approach for most people, but it is important to examine your long-term strategy from time to time.
Chart 6: Past 25 Years Show S&P 500 Returns Recovering Once Crisis Peaks
Market pullbacks call on us to reassess the tradeoffs between stocks, bonds, and regional allocations. It is too early to know when and where markets will settle, but we believe a balance of stocks and bonds will help clients navigate this turbulent transition.
We will be monitoring the impact of the war on unemployment, inflation, corporate earnings, and key leading economic indicators.
We look forward to hearing from you and providing updates on your portfolio and on our outlook for the rest of the year. Please reach out with any questions.
Best regards,
The Choate Wealth Investment Team