Choate Wealth is excited to launch Chart of the Week, a new weekly post highlighting a noteworthy development in the financial markets, economy, or business landscape. Each edition features a single chart and a few concise takeaways designed to provide perspective on the data behind the headlines. Written by our investment team, each Chart of the Week is intended to offer a quick, informative look at what is driving conversation and influencing markets.
Our first Chart of the Week is below.
Chart No. 1
With mortgage rates back above 7%, housing affordability faces further pressure. The chart below shows what the payment on the median home takes out of the median household’s income since 2010. The increase in housing costs has pushed the median first-time buyer age to an all-time high as young buyers are priced out of homeownership.
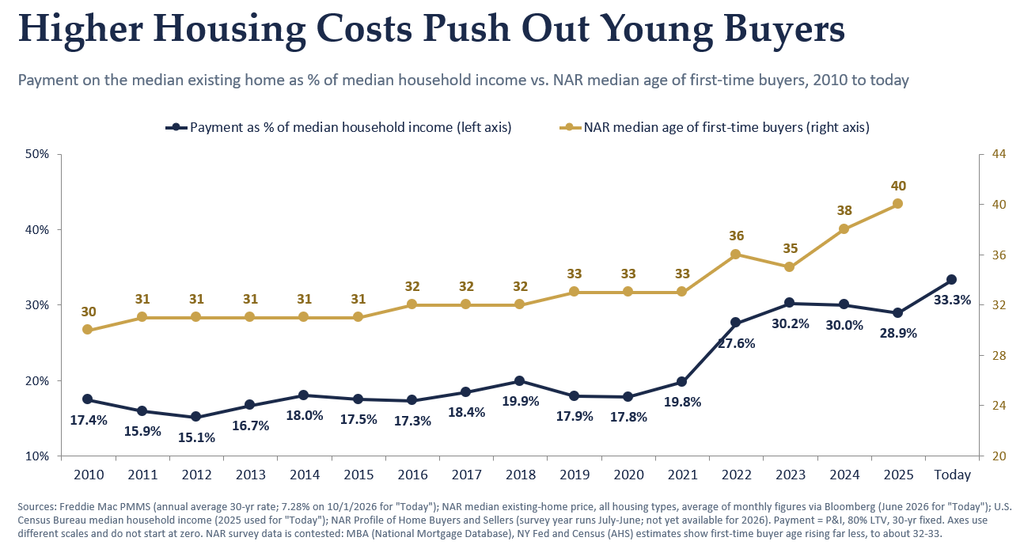
- Affordability has deteriorated sharply. The payment on the median home now takes about 33% of median household income, versus 15-20% from 2010 through 2021. Home prices are up about 2.4x since 2010 while median income is up only about 1.8x. A home now takes a much bigger bite of the median consumer’s paycheck crowding out other purchases or preventing homeownership at all.
- The increase started with price, but rates are doing the recent damage. Falling rates masked the price run-up through 2021, which is why the % of the median household income stayed flat for a decade. Since then, 30-year rates have gone from about 3% to over 7%. This increase in financing costs on top of significant price appreciation has led to the current affordability challenge. In fact, at 2021’s rate, today’s median payment would still be about 20% of income instead of 33%.
- Younger buyers feel it most. The National Association of Realtors (NAR) reports the median first-time buyer age hit a record 40 in 2025, up from 33 in 2021. First-time buyers also fell to a record-low 21% of purchases compared to a historical norm of 40%. This is consistent with higher payments pushing younger buyers out – delaying a core source of wealth building and reducing activity in industries tied to housing, from construction to home improvement and retail.
If you’d like to receive the Chart of the Week directly in your inbox, please sign up below.