The Second quarter was dominated by tariffs, the Israel-Iran conflict, and the “Big Beautiful Bill.” Equity markets were volatile – declining in April before rebounding as the Trump administration eased trade tensions with the U.S. and China. In addition, continuing AI infrastructure spending bolstered tech stocks further. For example, starting on January 1st, Nvidia stock (NVDA) declined nearly 30% through April but is now up 18% through June (see chart below). For the quarter, the MSCI All Country World Index is up 11.7% and the S&P 500 Index is up 10.94%. Bonds were largely flat for the quarter as the Bloomberg Aggregate Bond Index was up 1.21%.
The Trump administration is surprisingly successful in exercising unilateral power over domestic and foreign policy in its first six months. We continue to see trade issues creating crosswinds in the economy, and it is still too early to assess the impact of ongoing trade discussions. It is important to note that the Trump administration’s negotiating strategy is transactional and very fluid, relying on frequent tactical shifts, which makes predicting future outcomes very difficult for investors and adversaries alike.
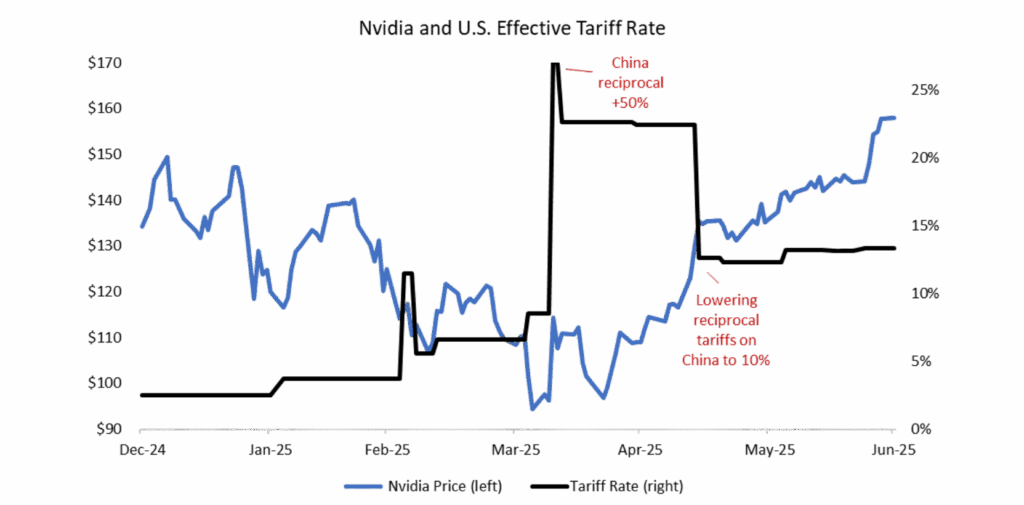
Our last quarterly update was written just as Trump paused his tariff push on April 9th. Now, we are writing ahead of a new trade deadline set for August 1st. Investors seem to be expecting the administration to eventually blink again, while actual tariff rates continue to increase. The chart below compares changes in the Nvidia stock price (in blue) to changes in the tariff rate (in black). You can see how both have been moving over the past few months. As the chart shows, the effective tariff rate currently sits at 13.4% versus 2.2% in 2024, a very significant increase from January.
Chart 1: Erratic Tariff Rates Rise From 2% to 13% This Year
Q1 2025 earnings grew an impressive 13.3%, ahead of consensus estimates of 6.6% growth, but full year earnings estimates did not change. The threat of tariffs may have pulled some consumer demand forward and led corporations to build inventory in advance of tariff charges. Did strong Q1 earnings “borrow” from later in the year, or will investors once again be surprised by the resiliency of U.S. companies to adapt to changing supply chains?
Chart 2: “Liberation Day” Tariff Announcement May Have Pulled Earnings Into Q1 From Future Quarters

Israel’s attack on Iran also worried investors in June, and U.S. participation in airstrikes led to a brief spike in oil prices. By early July, however, fears of a broader conflict have abated. Consumers benefited from lower inflation, as oil prices declined in light of increased supply and the potential for an economic slowdown. As we look toward the second half of the year, tariffs, inflation and geopolitical risk remain our primary concerns.
With the July 4th signing of the “Big Beautiful Bill,” we expect massive changes to federal taxes, spending policy, and debt levels. The major components include an extension of existing 2017 tax cuts, which are partially funded by large future cuts to the Medicaid and poverty assistance programs. In the near term, this bill produces a small economic benefit from the business tax credits embedded in the program. This should be a modest tailwind for GDP and corporate profitability into 2026. Over the medium term, the cuts to Medicaid are estimated to increase the number of uninsured by 16 million and are likely to strain health care and social support networks. Over the long term, this bill will add significantly to our federal budget deficit and will likely lead to higher interest rates as deficit funding crowds out spending on Federal discretionary programs. We plan on recording a podcast to further explore the tax and spending implications of this bill.
The U.S. economy faces other headwinds from the resumption of student loan payments, continued negative consumer and business sentiment, and a decline in international tourism to the U.S. At present, investors believe these factors are not sufficient to push the economy into recession, but the Conference Board’s Leading Economic Indicator composite inched down in May, triggering a cautious signal.
Chart 3: Crosswinds: Leading Economic Index (LEI) Declines While Unemployment Claims Remain Well Below Recessionary Levels
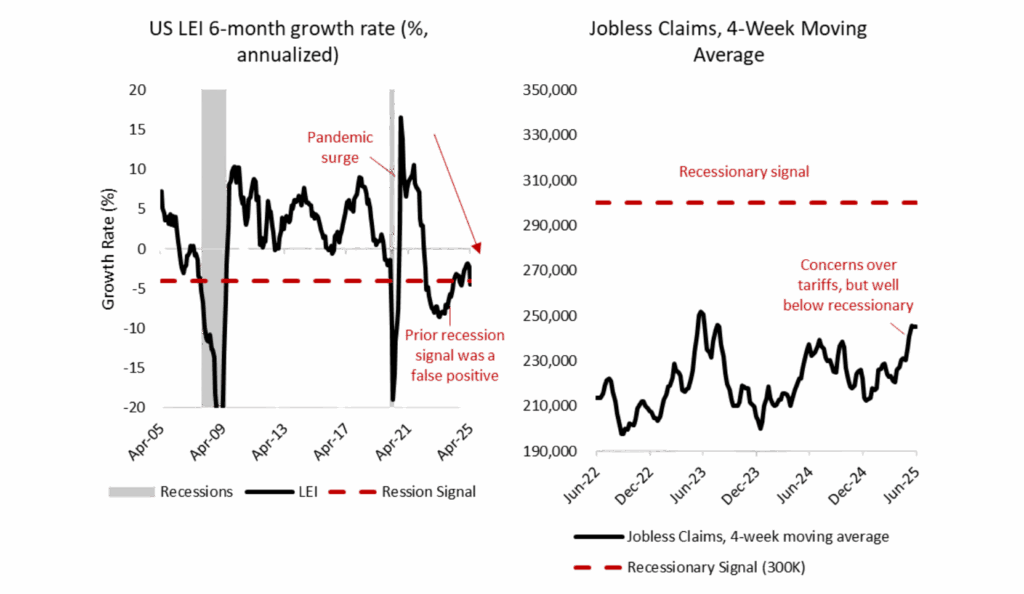
The dramatic trade policy shifts are leading the sentiment indicators into pessimistic territory, but these soft data signals can be volatile and misleading. Meanwhile, the unemployment rate remains low at 4.1% and job losses are also modest. We have not seen a meaningful pullback in either consumer or business spending. We are watching to see how businesses and consumers adapt to the ‘Tariff lag effect’ when higher tariffs lead to higher prices and supply chain disruption; a weakening job market will change this calculus for both households and businesses. The 4-week moving average for weekly unemployment claims is still below recessionary levels, but continuing claims are at the highest levels since 2021.
Looking deeper into changing labor markets, we worry about younger workers. As the chart below shows, the unemployment rate for recent college graduates is now higher than the nation’s overall unemployment rate (therefore a negative number on the chart, which subtracts the recent graduate unemployment rate from the national rate), whereas in the past it was lower than the national unemployment rate and thus a positive number on the chart below. Importantly, the data captures unemployment for college graduates ages 22-27. If we focused on the class of 2025, these figures would be much worse.
Chart 4: Recent College Graduates Struggle to Find Employment, Especially in High Pay Sectors
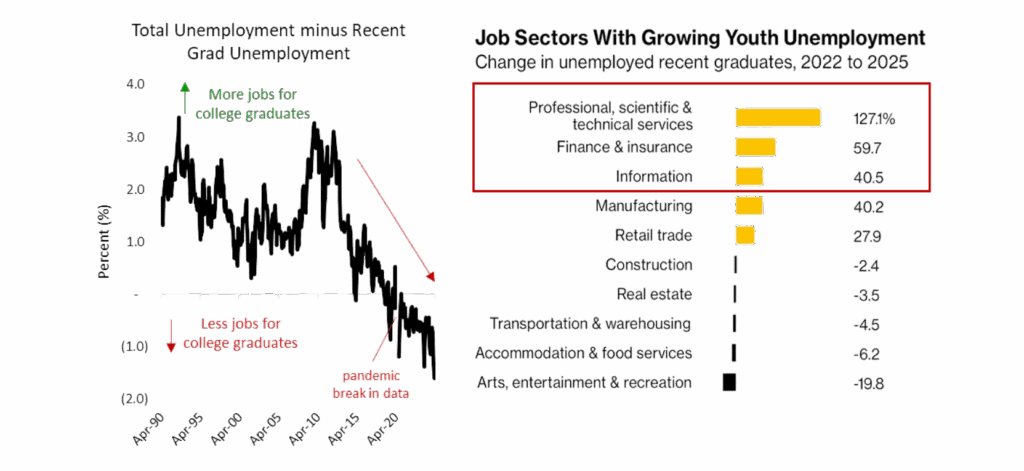
Health care, technology and finance sectors have seen the largest job loss for younger workers, and this trend predates the AI boom. These are all high paying sectors impacted by higher interest rates and R&D cuts, so there is certainly a cyclical component to this trend. The most recent gap in 2025 employment may indicate that corporations are hesitant to hire in this uncertain economic environment.
Entering the workforce near a cyclical trough can impair future earnings for more than a decade. This may also partially explain why young adults are less trusting of our societal institutions and increasingly pessimistic about their future. A Spring 2025 survey from the Harvard Kennedy School found that 4 in 10 Americans under the age of 30 say that they are “barely getting” by financially and only 56% have confidence in achieving their priority goal of financial security.
For these reasons, young voters are economically sensitive and may feel alienated by both political parties. This can lead to an anti-incumbent and anti-establishment voting bias in this cohort, perhaps leading to more frequent changes in control of Congress and the Presidency. We also notice a persistent decline in annual births. (We will explore the potential birth rate and demographic decline implications in our next quarterly newsletter)
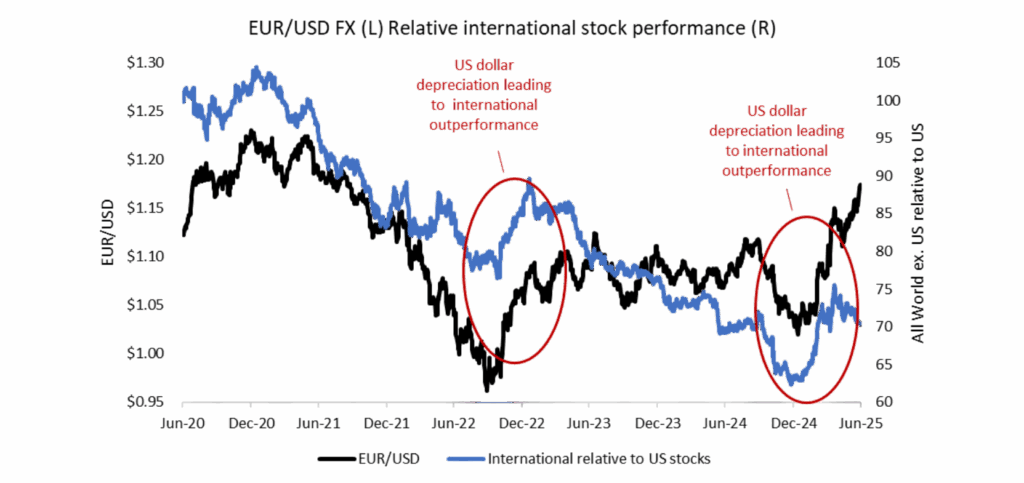
Lastly, during this period of uncertainty, we have benefited from portfolio diversification. Bonds have provided adequate safety and real income. Meanwhile, international stocks are having a banner year. Non-U.S. stocks are up 18.3% through June (12% points ahead of the U.S. S&P 500 Index). These results are propelled by a sharp depreciation in the value of the U.S. dollar year to date. The chart below juxtaposes two comparative ratios. The line in black reports the relative value of the Euro versus the U.S. dollar. The line in blue reports the relative price of European stocks versus U.S. stocks. As the chart highlights, international stocks tend to perform better (blue line rises) when the Euro gains value vs. the U.S. dollar (black line rises). We are now adding to international stocks in light of their low valuations and the decline in U.S. investment spending (from increased trade frictions).
Chart 5: Dollar Weakness, Spurs Relative International Stock Performance
In summary, Q2 had positive short term results for investors, as the global economy shrugged off near term headwinds and company earnings remain strong. Valuations remain extended, and there are some cracks in U.S. exceptionalism that bear watching for investors. We look forward to hearing from you and updating you on your portfolio and on our outlook for the next year. Please reach out with any questions.
Best regards,
The Choate Wealth Investment Team